
The percentage of reinsured direct premiums reached its highest level in 2022, at 5.9%.
| 2013 | 2017 | 2021 | 2022 | |
|---|---|---|---|---|
| Direct insurance premiums | 4 593 632 | 4 957 507 | 6 764 694 | 6 782 235 |
| Reinsurance premiums (1) | 240 000 | 245 000 | 383 753 | 400 487 |
| % reinsurance / insurance | 5.22% | 4.94% | 5.67% | 5.90% |
(1) Source Atlas Magazine study (2020, 2021 and 2022 premiums of 136 reinsurers). Source AM Best and Swiss Re for 2019 and prior years.
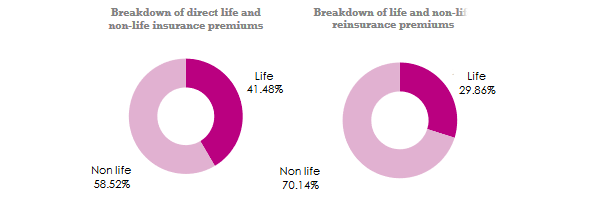
Reinsurance market in 2022: breakdown of life and non-life premiums
While direct insurance showcases a certain balance between life and non-life premiums, this proportionality disappears in reinsurance, which is largely dominated by non-life underwriting.
With premiums of 280.902 billion USD in 2022, the non-life business accounts for 70.14% of global reinsurance premiums, compared with 58.52% for direct non-life insurance.
Figures in millions USD
| Life insurance | In% | Non-life insurance | In% | Total premiums | In% | |
|---|---|---|---|---|---|---|
| Direct insurance premiums | 2 813 032 | 41.48% | 3 969 203 | 58.52% | 6 782 235 | 100% |
| Reinsurance premiums | 119 585 | 29.86% | 280 902 | 70.14% | 400 487 | 100% |
Reinsurance market concentration
In 2022, the top ten reinsurers accounted for 64% of worldwide premiums, life and non-life combined, or 255.705 billion USD. The top five – Munich Re, Swiss Re, Hannover Re, Canada Life Re and Berkshire Hathaway – accounted for almost 43.56% of total premium income (174.44 billion USD).
Another significant figure is that the top 20 reinsurers accounted for 80.28% of all underwritten business.
Read also | World's largest reinsurers in 2022
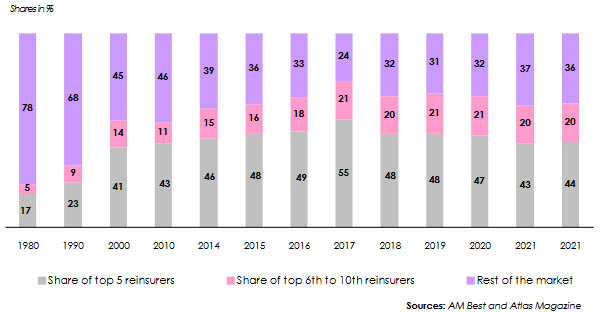
Trends in reinsurance market concentration: 1980-2022
From 22% market share in 1980 to 64% in 2022, the world's top ten reinsurers largely dominate the industry. Concentration peaked in 2017, with the top 10 players accounting for 76% of the market and the top 5 for 55%.
By 2021-2022, a certain stabilization has set in, with rates of 63% and 64% respectively.
Key indicators of reinsurance companies: 2021-2022 (1)
Shareholders’ equity and share capital
In 2022, shareholders' equity for all reinsurers in all zones combined amounted to 926.213 billion USD, down 13.27% on 2021. The share capital of these same players shows a less pronounced decline than shareholders' equity, with a rate of -3.95% reported between 2021 and 2022.
The top 10 reinsurers account for almost 79% of cumulative equity. The rest of the market, some 130 companies, share the remaining 21%.
Berkshire Hathaway alone accounts for almost 52% of the industry's equity. Swiss Re is ranked 13th, well behind Munich Re in 6th place, but ahead of another reinsurance giant, Hannover Re, in 14th place. French reinsurer SCOR is not among the top 20 reinsurers ranked on equity basis.
Net income
In 2022, the reinsurance market has posted a brutal 61.53% drop in net income, going from 52.156 billion USD in 2021 down to 20.062 billion USD in 2022, one of the record years in terms of natural catastrophes. 27 of the top 100 reinsurers in the ranking below have reported losses in 2022, compared with 15 in 2021. Bermuda's Fortitude Re is the reinsurer with the biggest net loss in 2022, at over 7 billion USD.
(1) Atlas Magazine study (Key indicators 2021 and 2022 for 136 reinsurers).
Read also | Reinsurers: ranking per net result
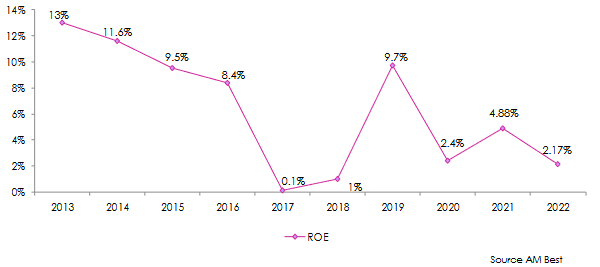
Retour sur fonds propres (ROE)
Le rendement des fonds propres (ROE) de l’ensemble des réassureurs atteint 2,17% en 2022. Il s’agit du troisième taux de rendement le plus faible depuis 20 ans. Le ROE a été lourdement impacté en 2017 et 2018 par la hausse de la sinistralité catastrophes naturelles après la survenance de trois ouragans majeurs Harvey, Irma et Maria. Le marché s’est bien redressé en 2019 (+9,7%) après le durcissement des conditions de renouvellement imposés par les réassureurs.
L’effet Covid-19 pèse sur l’exercice 2020 qui enregistre un modeste ROE de 2,4%.
Read also | Reinsurers: ranking per return on equity
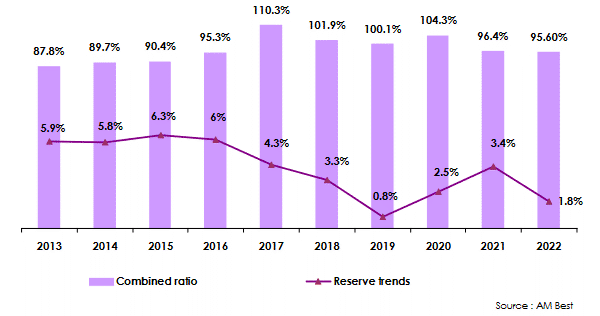
Ratio combiné
Le ratio combiné qui n’a cessé de croître de 2013 à 2016, tout en restant inférieur à 100%, enregistre un fort dérapage en 2017, année des ouragans Harvey, Irma et Maria. Cet indicateur technique reste supérieur à 100% pour les exercices 2018, 2019 et 2020. La crise sanitaire du Covid -19 pèse sur les résultats de 2020 faisant remonter le ratio combiné de 101,9% en 2019 à 104,3% en 2020.
Les ajustements tarifaires opérés par les réassureurs lors des renouvellements de 2021 et 2022 contribuent au renversement de tendance enregistré au cours des deux derniers exercices.
L’exercice 2021 se termine par une amélioration sensible du ratio combiné moyen de 7,9 points passant de 104,3% en 2020 à 96,4% en 2021. Cette tendance baissière se confirme en 2022 avec un gain de profitabilité technique de 0,8%, et ce, malgré un montant élevé de pertes catastrophes naturelles qui dépassent les 100 milliards USD en 2022.